
- Uncertainty
- Medium
- Decision relevance
- Medium
- Resolvability scale
- Long-term sustained deployment
Changes to the atmospheric circulation in the mid-latitudes are important as they control how climate is felt, particularly through weather extremes, in these regions. Features of interest include the latitudinal position and strength of the jets, location of storm tracks, and the frequency and persistence of blocking events, all of which contribute to determining the occurrence of heatwaves, extreme winter cold, drought and heavy precipitation in mid-latitude regions. Recent events illustrate these potential impacts; 2026 saw the hottest June-July period on record in Western Europe (Copernicus, 2026), in a period dominated by a persistent high pressure system over the region (Keeping et al., 2026). At the other end of the spectrum, winter cold extremes in the mid-latitudes have been linked to rapid Arctic warming and sea-ice loss (e.g. Francis & Vavrus, 2012), mediated by weakening of the polar jet, although the causes and strength of links are contested (Blackport & Screen, 2020; Cohen et al., 2020). How extratropical circulation and extreme events will change with climate change itself remains very uncertain. For changes induced by SAI, we have some mechanistic understanding of the expected changes to circulation that enable a somewhat clearer picture. We generally understand changes to the equator-to-pole gradients and tropical lower stratospheric heating, especially with equatorial injection. For stratospheric heating, we also have evidence from volcanic eruptions to draw on. However, as with greenhouse gas-driven warming, our ability to quantitatively predict changes to mid-latitude surface climate (especially weather extremes) driven by circulation changes under SAI is currently limited. This uncertainty spans a large range of phenomena, and links strongly to uncertainty in the Surface climate response to stratospheric heating, Tropical circulation and Large-Scale Modes of Atmospheric or Atmosphere-Ocean Variability. While changes are expected in both hemispheres, this entry will focus on the Northern Hemisphere response. We note that this uncertainty is principally related to understanding the causes of residual changes under SAI relative to the target/baseline. These are generally expected to be smaller than the direct impacts of reducing temperature. For example, the winter time residual Eurasian warming discussed below refers to perhaps a 1°C under-cooling relative to the target temperature, while the majority of warming (3-4°C) is successfully offset by SAI (Visioni et al., 2021; Jones et al., 2021).
Metric
A change in winter cold extremes in the mid-latitudes due to the circulation response to SAI, detectable on a 50-year timescale at 0.5°C cooling relative to a baseline climate state with the same global mean temperature.
Uncertainty
As a reference point, Figure 1 shows the change in annual mean (left) and winter cold extremes (right) under the G6-1.5K-SAI experiment, which is similar to our assumed deployment scenario. All models show some regions of significant changes to cold extremes, as measured by the number of days with minimum temperature anomaly below the 10th percentile in the baseline state (TN10p), when using 60 years of simulation data. However, this difference is assessed at several times greater cooling than our metric assumes. New research is required to assess in detail the changes to winter extremes in the mid-latitudes, and how the detectability would vary with time of assessment period, magnitude of cooling, and degree of spatial aggregation. Based on Figure 1 above, we judge that this metric is plausible but less likely than not, giving a medium uncertainty.
Decision relevance
As a reference point, Figure 1 shows the change in annual mean (left) and winter cold extremes (right) under the G6-1.5K-SAI experiment, which is similar to our assumed deployment scenario. All models show some regions of significant changes to cold extremes, as measured by the number of days with minimum temperature anomaly below the 10th percentile in the baseline state (TN10p), when using 60 years of simulation data. However, this difference is assessed at several times greater cooling than our metric assumes. New research is required to assess in detail the changes to winter extremes in the mid-latitudes, and how the detectability would vary with time of assessment period, magnitude of cooling, and degree of spatial aggregation. Based on Figure 1 above, we judge that this metric is plausible but less likely than not, giving a medium uncertainty.
Changes to the atmospheric circulation under SAI relative to the target baseline (i.e. after controlling for changes driven by differences in global mean temperature) have various drivers. These include lower-stratospheric heating from aerosol long-wave absorption (see Surface Climate Response to Stratospheric Heating) and residual changes in regional and seasonal temperature fields, as well as any direct (fast) responses to CO2 itself which are not temperature driven and therefore not offset by SAI.
Under low latitude or equatorial injection, the stratospheric heating forced changes include strengthening of the polar vortices and poleward shift of the tropospheric eddy-driven jets (e.g. Richter et al., 2018; Visioni et al., 2020), and an associated positive winter North Atlantic Oscillation (e.g. Jones et al., 2021) and Southern Annular Mode (Bednarz et al., 2022). These changes are associated with a northern Eurasian winter warming relative to the target state (Banerjee et al., 2021). All of these effects, however, are expected to be strongly dependent on the injection scenario. The largest stratospheric-heating-driven impacts on circulation (at a given global temperature) are expected for equatorial injection scenarios (see Surface Climate Response to Stratospheric Heating). With higher latitude injection, reduced impacts or even effects of the opposite sign are plausible (Bednarz et al., 2023b). Circulation impacts driven by stratospheric heating are also likely non-linear in magnitude of injection, with the SAI-forced NAO response only apparent at higher injection magnitudes and larger cooling (Bednarz et al., 2023c).
SAI scenarios with low latitude injection result in residual Arctic warming relative to the target state which would also drive circulation changes. We discuss this pathway for circulation changes less here since it is mostly avoided under scenarios with injection outside the tropics, which largely reduce polar under-cooling (e.g. Lee et al., 2026). Some impacts likely still remain, however. For example, Jiang et al. (2019) demonstrate loss of winter sea ice and residual winter warming, particularly in the Barent-Kara Seas, under a scenario which otherwise mostly successfully controls the global annual-mean spatial pattern of temperature. Such sea-ice loss and warming in the Barents-Kara Seas might be expected to increase cold extremes over Northern Eurasia (Zhang et al., 2018).
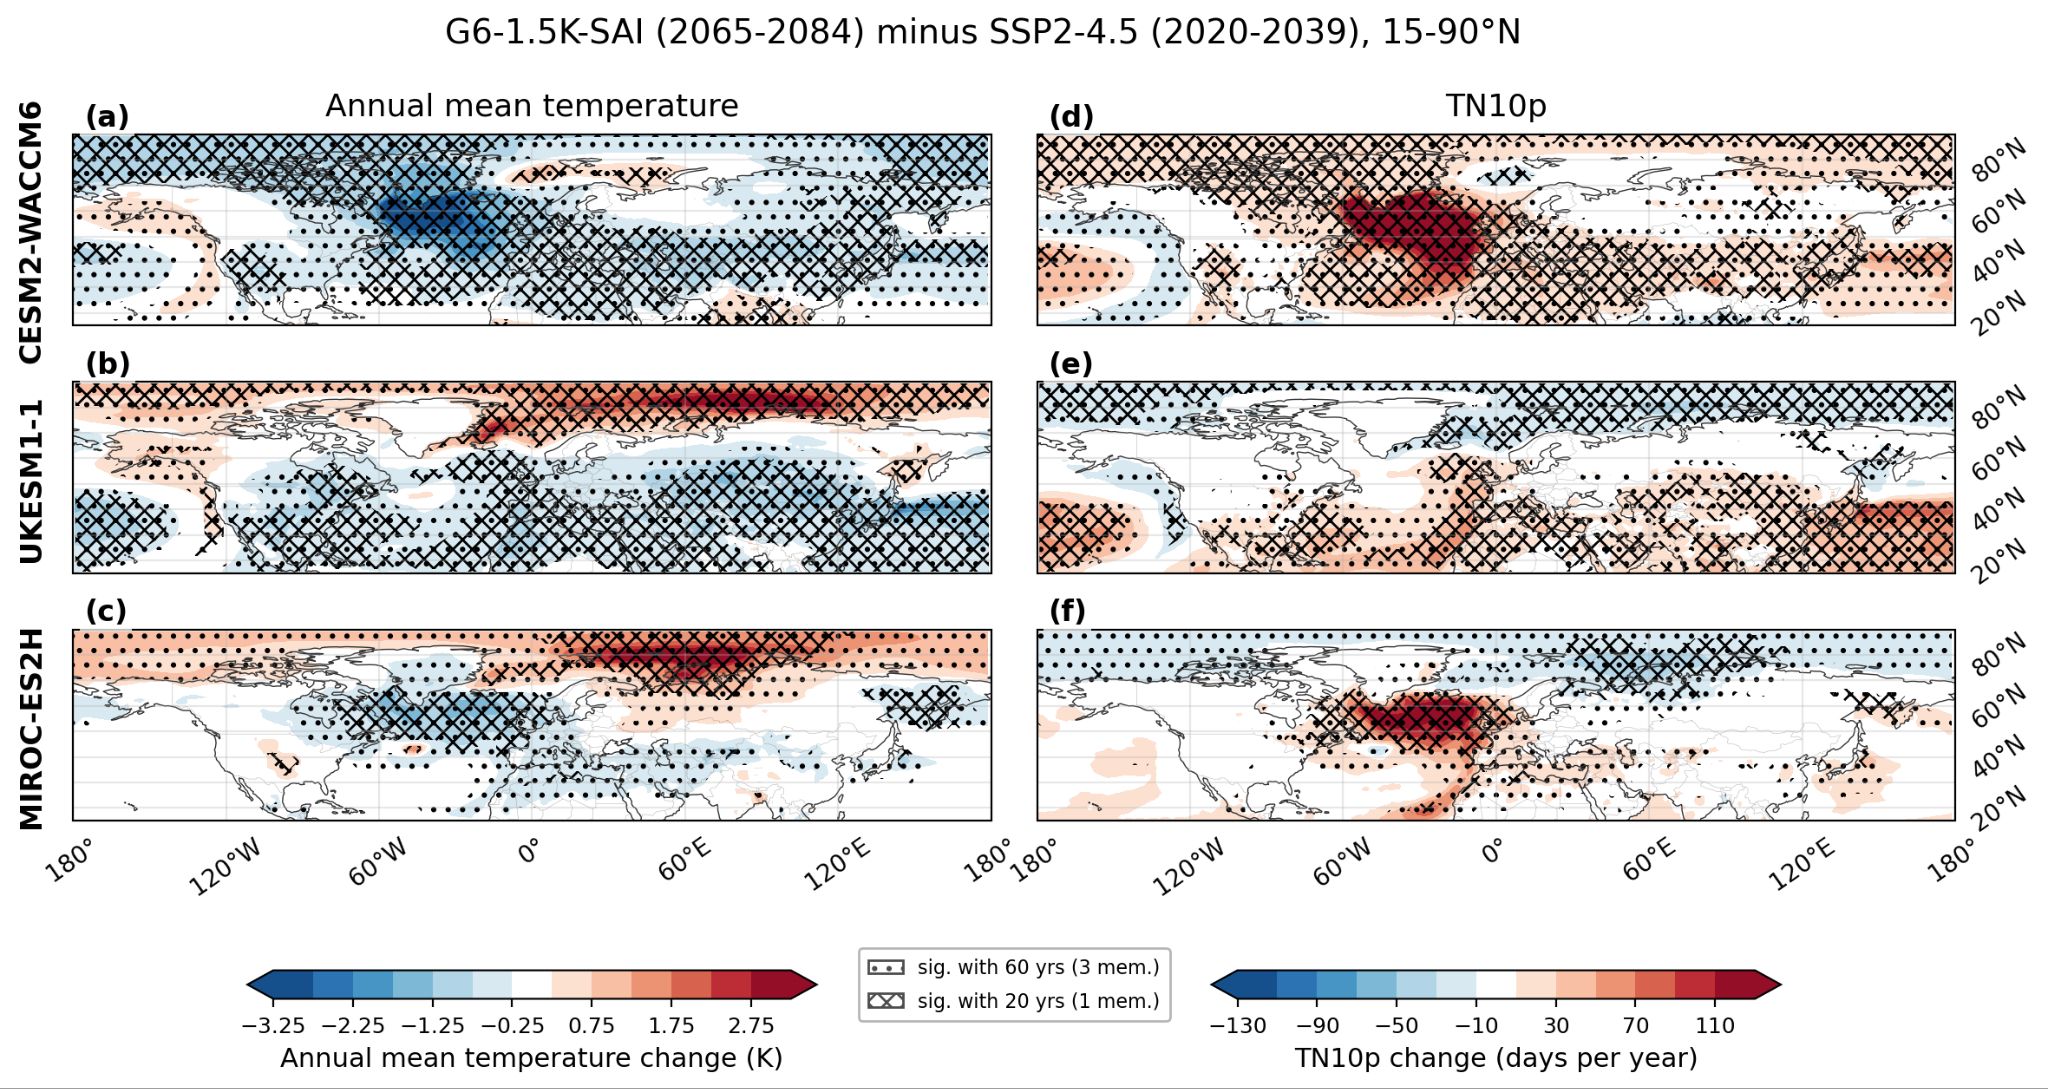
Figure 1: (a-c) annual mean temperature difference between the G6-1.5K-SAI scenario and the baseline at the same global mean temperature under the SSP2-4.5 scenario (2020-2039). (d-f) change in number of days per year with minimum temperature below the 10th percentile of the baseline period (TN10p). Statistically significant changes (at the 10% false discovery rate using a Welch’s t-test) indicated; dots indicate grid cells with significant changes when testing across 20 years of data provided by a single ensemble member, and hashes indicate changes significant with 60 years of data (3 members).
References
16Have feedback on this entry?
Spot something off, missing, or worth adding? We’d love to hear from you.
Share feedback